Objective and Overview
In this lesson, students will explore when three lengths can and cannot form a triangle. In doing so, they will randomly break a line of length 10 into three lengths and determine how often those lengths form a triangle.
Warm-Up
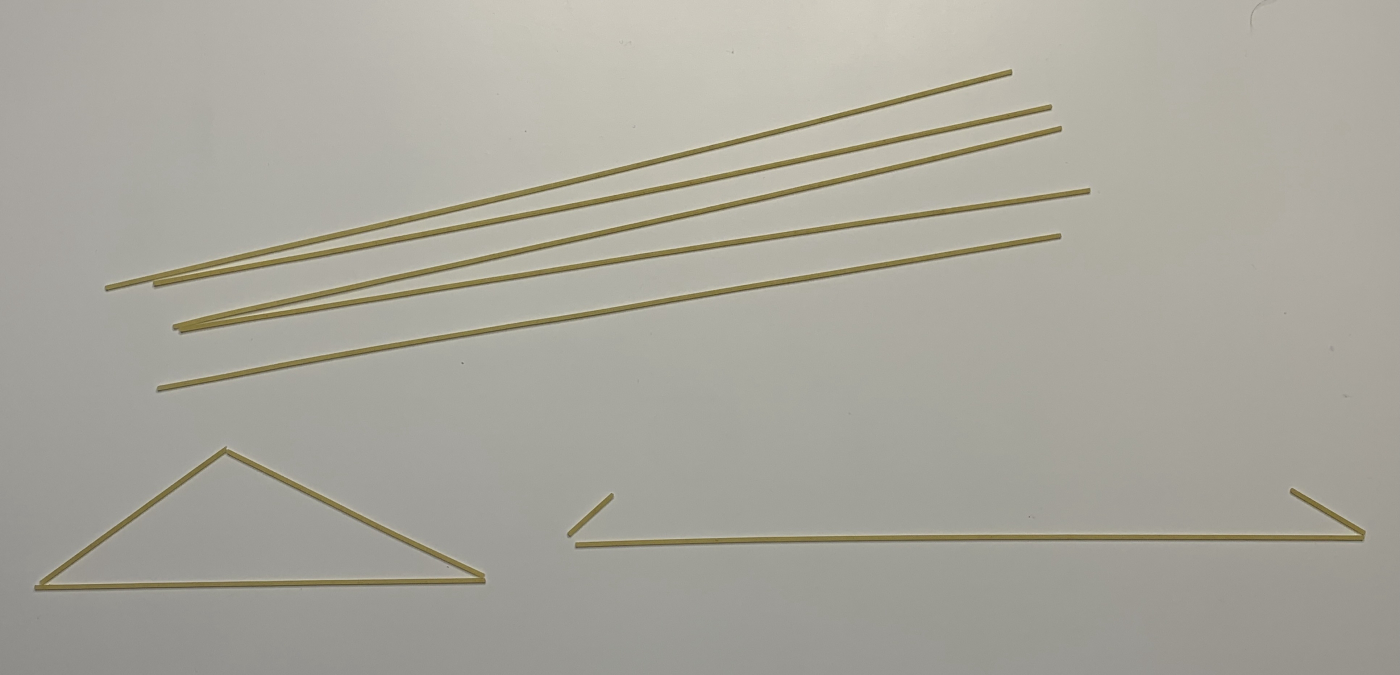
Begin by handing out 2 piece of uncooked, straight pasta to each student. Invite them to break each piece of pasta in two places. For the first piece, they should try to break the pasta so that they three pieces DO form a triangle. For the second piece, they should try to break the pasta so that the three pieces do NOT for a triangle. Once everyone is finished, consider having the students walk around the room to see their classmates’ work.

Main Activity
Share with students that they will now be breaking a line of length 10 cm in 2 places completely at random and then trying to form a triangle with those three lengths. Invite students to discuss in groups how often do they think the three lengths will form a triangle. After a few minutes of small group discussion, invite each group to share their prediction with the class and record the varying predicted percentages on the board.
Now, each student will conduct trials of this activity on this Polypad canvas. Before the lesson, watch this video to learn how to use this canvas. You may want to do a few examples as a class before having students work individually.
After students have had some time to generate many examples on their canvas, pause their work and ask student to discuss in pairs or in small groups about when their three lengths are able to make a triangle and when they are not. Invite them to summarize their ideas into a general statement and then discuss as class. Now would be a good time to formalize their triangle inequality theorem: The sum of any two sides of a triangle must be greater than the third side.
Closure
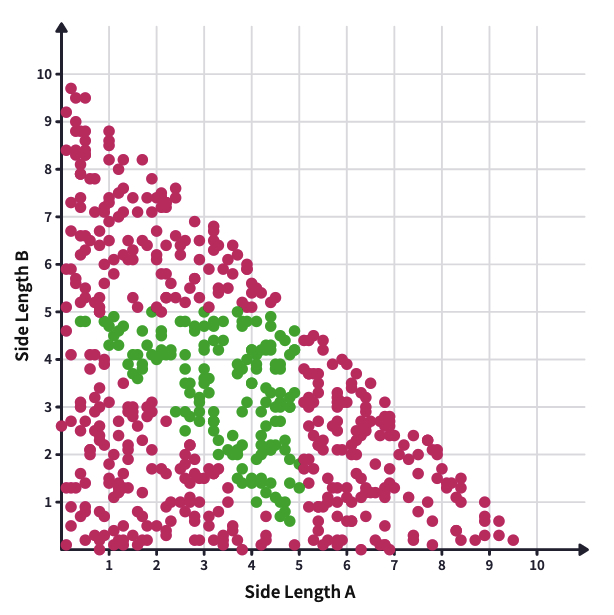
Once the theorem has been established, turn the attention of the class to the second question of the lesson: how often the random cuts will create three lengths that form a triangle. Compiling all of the data onto one Polypad will help students see the geometric representation of the probability. Invite students to enter their data points onto a shared class spreadsheet. Be sure to have a separate tab for the points that do make a triangle and a tab for the ones that do not make a triangle. Once all the data is in the spreadsheet, copy and paste the data into a new table the Polypad canvas for this lesson and then plot all the point.
If you are not able to compile the data, you may share this canvas with students. Over 500 data points have been plotted on this graph, and the visual nicely shows that a triangle can be formed 25% of the time:

As time allows, you may want to discuss what is happening in each of the triangular-regions of the graph. For example, the bottom right red triangular region contains situations where A is too long and B is too short to make a triangle.
Polypads For This Lesson
To assign these to your classes in Mathigon, save a copy to your Mathigon account.
Click here to learn how to share Polypads with students and how to view their work.